Chart တွေ ဆွဲကြမယ်ဆိုရင် အများအားဖြင့် ရွေးချယ်ကြတာတော့ column chart တွေပါပဲ။ ဒါပေမယ့် တချို့ ပုံတွေမှာ column chart အစား bar chart ကို သုံးပြီး ဆွဲတာက ပိုပြီးသင့်တော်ပါတယ်။
နံပါတ် ၁ အချက် က data points တွေ အများကြီးကို ပြချင်တဲ့အချိန်မှာ ဖြစ်ပါတယ်။
နံပါတ် ၂ အချက်က category label စာသားတွေက အရမ်းရှည်တဲ့အချိန်မှာ column chart မှာ ပြတာနဲ့ စာရင် bar chart က ပိုပြီး ကြည့်လို့ အဆင်ပြေစေပါတယ်။
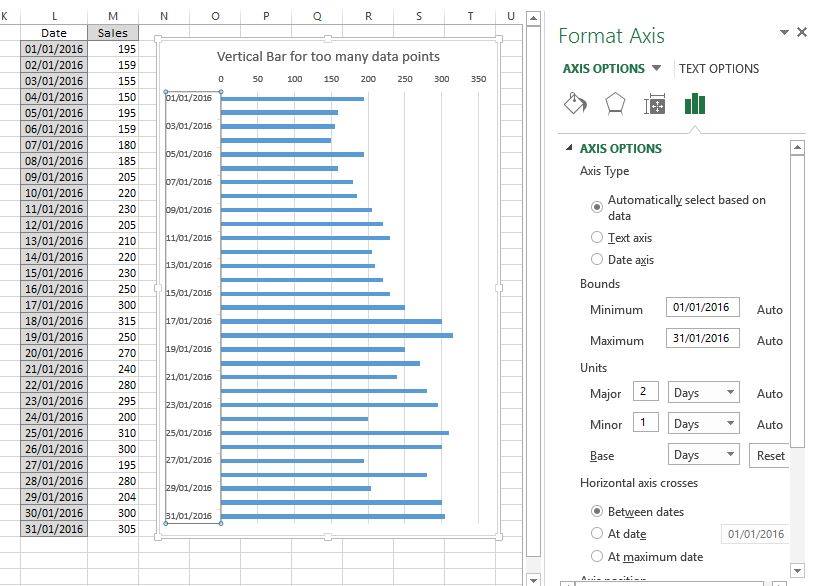
ပုံ ၁ : လတစ်လ ထဲမှာရှိတဲ့ တစ်ရက်ချင်း ရောင်းအား တွေကို bar chart နဲ့ ဆွဲထားတာပါ။ 31 ရက်စာ ရက်တွေ ကို category မှာ ရက်ခြားစီ နဲ့ ဖော်ပြထားတဲ့အတွက် ကြည့်ရတာ ပိုရှင်းပါတယ်။ အဲလို ရက်ခြားပြီးဆွဲချင်တယ်ဆိုရင် Category Axis မှာ right click နှိပ်ပြီး ပေါ်လာတဲ့ menu မှာ Format Axis ကို ရွေးပါ။ Format Axis pane ရဲ့ Axis Option ထဲက Unit မှာရှိတဲ့ Major မှာ ပေးပြီး Days ကို ရွေးပါ။
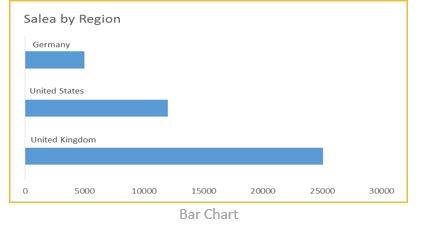
ပုံ ၂ : Category label တွေကို Bar ပေါ်မှာ ပြထားတာပါ။
There are two reasons for choosing bar chart instead of column charts.
- Reason 1 is when multiple data points are required to display.
- Reason 2 is when long category labels are required to display.
- Chart 1 is the bar chart for multiple data points to show each daily sales within a month. 31 days data are displayed but category labels skip 1 day for clarity. Right click on the category axis, select Format Axis. In the Format Axis Pane, under Axis Options, set the Major under Units section to 2 and select the Days.
- Chart 2 is the bar chart with long category label tag directly onto the bar.