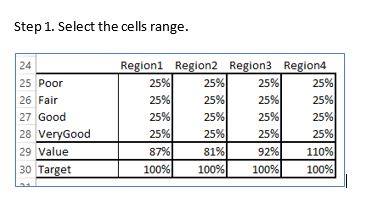
Bullet Graph က target နဲ့ actual value ကို rating points တွေနဲ့ ဖော်ပြတဲ့ အချိန်မှာ အသင့်တော်ဆုံး ဖြစ်ပါတယ်။ ပုံမှာ ပြထားတဲ့ ဥပမာမှာ ရောင်းအားရဲ့ ရာခိုင်နှုန်းပေါ်မူတည်ပြီး Poor, Fair, Good နဲ့ Very Good ဆိုတဲ့ rating point လေးမျိုး သတ်မှတ်ထားပါတယ်။ ရောင်းအား 25% ထိကို Poor, 26% ကနေ 50% ထိကို Fair, 51% ကနေ 75% ထိကို Good နဲ့ 75% အထက်ရှိမယ်ဆိုရင် Very Good ဖြစ်ပါတယ်။ ရောင်းအား target ကို 100% သတ်မှတ်ထားပြီး Step1 မှာပြထားတဲ့ table မှာ region လေးခုရဲ့ သတ်မှတ် rating point, actual value နဲ့ target value တို့ကို ပြထားပါတယ်။
Graph ကို အောက်ပါအဆင့်များနဲ့ ဆွဲနိုင်ပါတယ်။
- Cell range ကို select လုပ်ပါ။
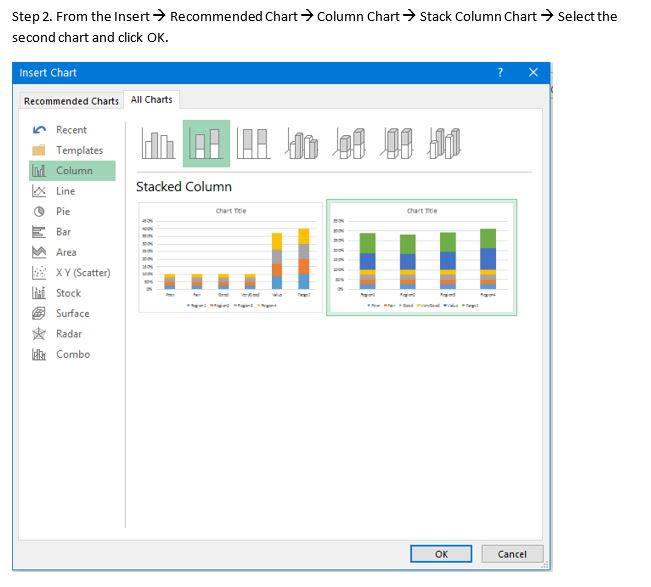
- Insert Chart မှာ Column Chart အောက်ရှိ Stack Column Chart ကို နှိပ်ပြီး ပြထားတဲ့ chart ပုံစံထဲက ဒုတိယပုံကို ရွေးပါ။ OK ကို နှိပ်ပါ။
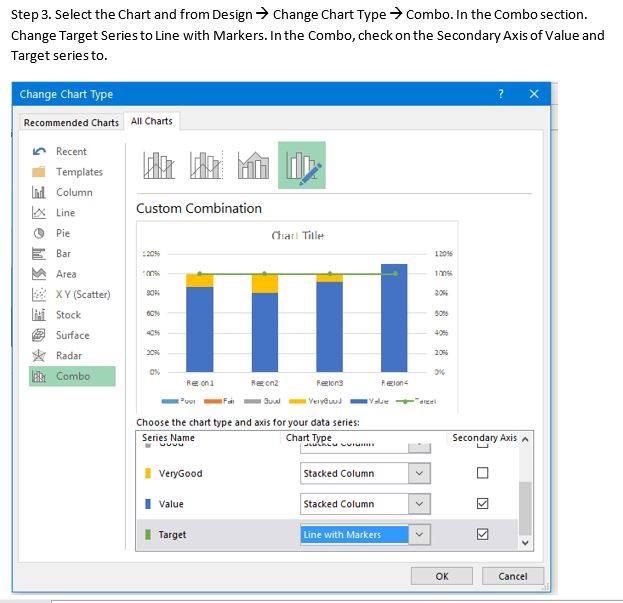
- Insert Chart မှ Combo ကို ရွေးပါ။ Combo section ရဲ့ Target data series မှာ "Line with Markers" ကို ရွေးပါ။ Target နဲ့ Value data series မှာ Secondary Axis ကို Check လုပ်ပါ။
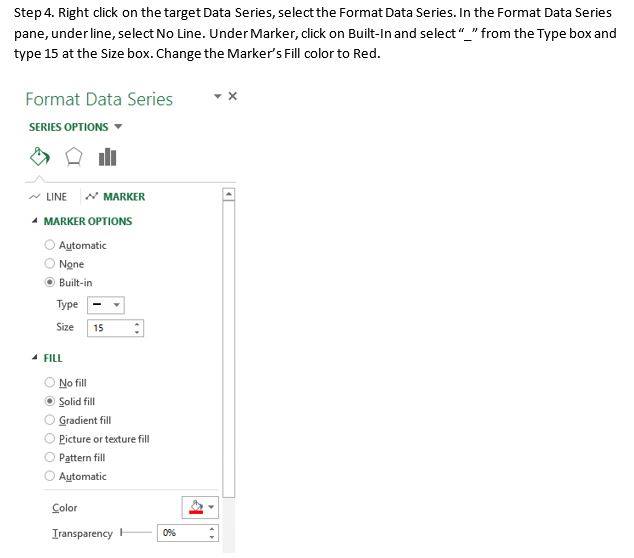
- Chart ရဲ့ Target data series ကို right click နှိပ်ပြီး Format Data Series ကို ရွေးပါ။ Format Data Series pane ရဲ့ Line မှာ No Line ကို ရွေးပါ။ Marker ရဲ့ Built In ကို နှိပ်ပြီး Type မှာ _ ကို ရွေးပါ။ Marker Size ကို 15 ပေးပြီး Marker color ကို အနီရောင်ရွေးချယ်ပါ။
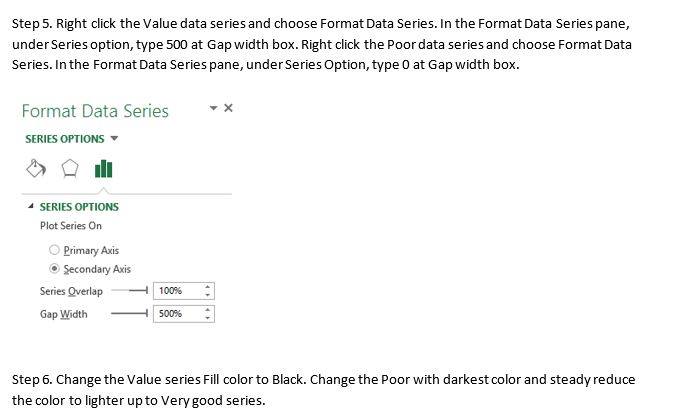
- Value data series ကို right click နှိပ်ပြီး Format Data Series ကို ရွေးပါ။ Format Data Series pane ရဲ့ Series option အောက်မှာရှိတဲ့ Gap Width မှာ 500 ပေးပါ။ Poor data series ရဲ့ Gap Width ကို 0 ပေးပါ။
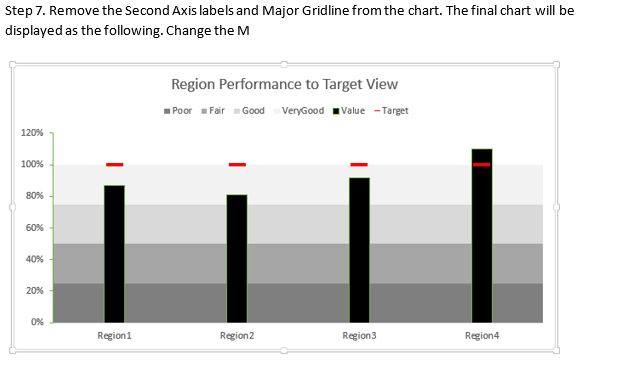
- Value series color ကို အနက်ရောင် ပေးပါ။ Poor data series color ကို မီးခိုးရင့်ပေးပြီး Fair, Good, Very Good ကို မီးခိုးရောင် အဆင့် တစ်ဆင့်ချင်း လျော့ပေးပါ။
- Chart မှာ secondary axis label နဲ့ major grid line တို့ ကို ဖျောက်လိုက်ပါ။ bullet chart ကို step 7 က ပုံအတိုင်း မြင်ရပါမယ်။
Bullet Graph is best suited to present the value vs target in specified values of rating points.
In the example, there are 4 rating points as Poor, Fair, Good and Very Good.
- If the sales reach between 0 to 25% the target, it will be in Poor stage.
- If the sales reach between 26% to 50% of the target, it will be in Fair state.
- If the sales reach between 51% to 75% of the target, it will be in Good state.
- If the sales reach more than 75% of the target, it will be in Very good state.
The target is 100%. There are 4 regions with the actual sales value, shown as the ratio percent against target. The attached figures will show the steps to get the final chart.