တခါတလေမှာ Chart ရဲ့ Line တစ်ခုထဲမှာ လက်ရှိ တစ်နှစ်စာ trend data ကို နောင်လာမယ့် 6လ forecast နဲ့ တွဲပြီး ပြချင်တာမျိုး ရှိပါတယ်။
ဒီပုံစံမျိုး ပြဖို့အတွက် data ပြင်တဲ့အခါမှာ လက်ရှိ 12 လ (Jan ကနေ Dec) အထိကို A2 ကနေ A13 ထိ ထည့်ပါတယ်။ B1 မှာ လက်ရှိနှစ်အရောင်းကို ဖော်ပြမယ့် 2015 Sales ခေါင်းစဉ်တပ်ပြီး B2 ကနေ B13 အထိမှာ လစဉ်ရောင်းအားတွေ ဖြည့်ပါတယ်။
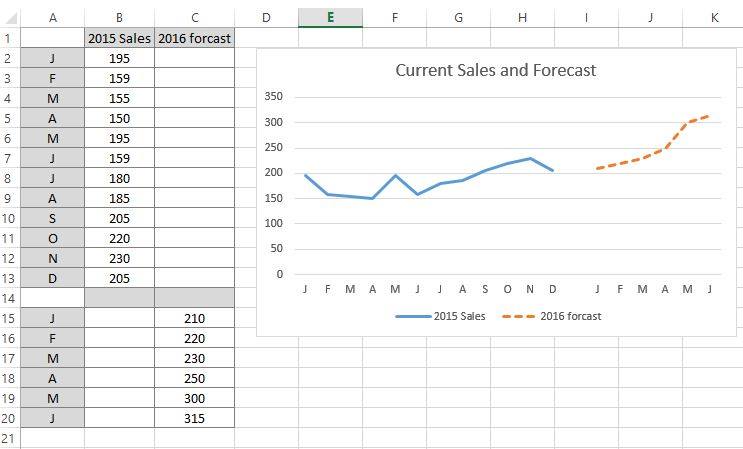
Forecast အတွက် A15 ကနေ A20 အထိမှာ ကိုယ် Forecast လုပ်တဲ့ လတွေဖြစ်တဲ့ (Jan ကနေ Jul) ထည့်ပါတယ်။ C1 မှာ 2016 Forecast လို့ ခေါင်းစဉ်တပ်ပြီး C15 ကနေ C20 အထိမှာ Forecast တန်ဖိုးတွေ ထည့်ပါတယ်။
ပြီးရင်တော့ Data အားလုံး select လုပ် Line Chart ဆွဲပြီး Forecast line ကို dash ပုံစံနဲ့ color တစ်မျိုးပေးပြီး format လုပ်လိုက်ရင် ပုံမှာ ပြထားသလို လက်ရှိ 12 လ နဲ့ တစ်လိုင်းထဲမှာပဲ ခွဲခြားကြည့်လို့ ရသွားပါတယ်။
To display the current sales of current year and next 6 months sales in one line, the data will be need to prepared in 2 columns as in the figure. Then draw a line chart. Format the target line with dash type line. Current sales is in solid line and sales target is in dash line.