Gantt chart ကို သုံးပြီး project time span ကို ပုံနဲ့ ဖော်ပြနိုင်ပါတယ်။ လက်ရှိမှာ project plan ကို ဖော်ပြတဲ့ tool တွေ အများအပြား ရှိနေပေမဲ့ Excel ကို သုံးပြီးလဲ အလွယ်တကူရေးဆွဲနိုင်ပါတယ်။
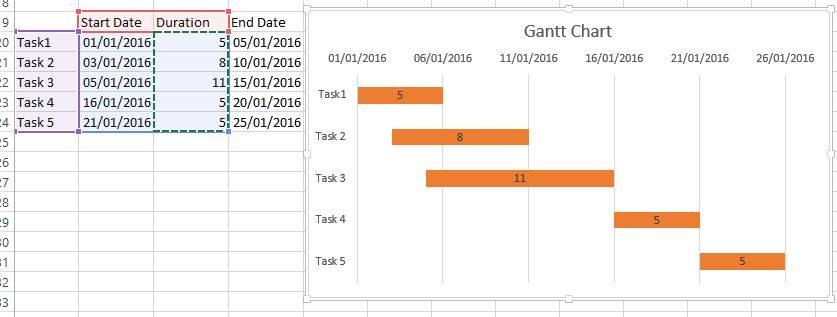
ဥပမာ။ ။ အဆင့် ၆ဆင့် ရှိတဲ့ project တစ်ခုအတွက် plan ကို ပုံဆွဲကြည့်ပါမယ်။ Project ရဲ့ task 1 ကနေ 5 အထိကို အစရက်စွဲ၊ တစ်ဆင့်စီအတွက် ကြာမယ့် ရက်နဲ့ task တစ်ခုချင်းစီရဲ့ အဆုံးသတ်ရက်တို့ကို ပုံမှာ ပြထားတဲ့ အတိုင်း ထည့်ထားပါမယ်။
- Project plan ကို ထည့်သွင်းထားတဲ့ cell range ကို select လုပ်ပြီး Stack Bar Chart ကို ရွေးပါ။
- Start Date data series ပေါ်မှာ right click နှိပ်ပြီး Format Data Series ကို ရွေးပါ။ Format Data Series pane ရဲ့ Fill option မှာ No Fill ကို ရွေးပါ။
- Vertical Category Axis ပေါ်မှာ right click နှိပ်ပြီး Format Axis ကို ရွေးပါ။ Format Axis pane ရဲ့ Axes option မှာ Category is Reverse Order ကို Check လုပ်ပါ။
- Project time plan ကို Gantt chart အနေနဲ့ မြင်ရပါမယ်။
Gantt chart is a tool to display project time span in pictorial form. There are many tools in the market to create project plan. But what present here is how an excel chart can be set up as a Gantt chart in a simple step. Assume the project has 5 task to complete which starts in separate date with required time period to work done.
- Select the data range and create a Stack Bar Chart.
- Right click the Start Date data series and select Format Data Series. In the Format Data Series pane, under Fill option, select No Fill.
- Right click the Vertical Category Axis and select Format Axis. In the Format Axis pane, under Axes Option, check to turn on the Category is Reverse Order.
- The Gantt chart will be displayed as the figure.