Outlet Distribution
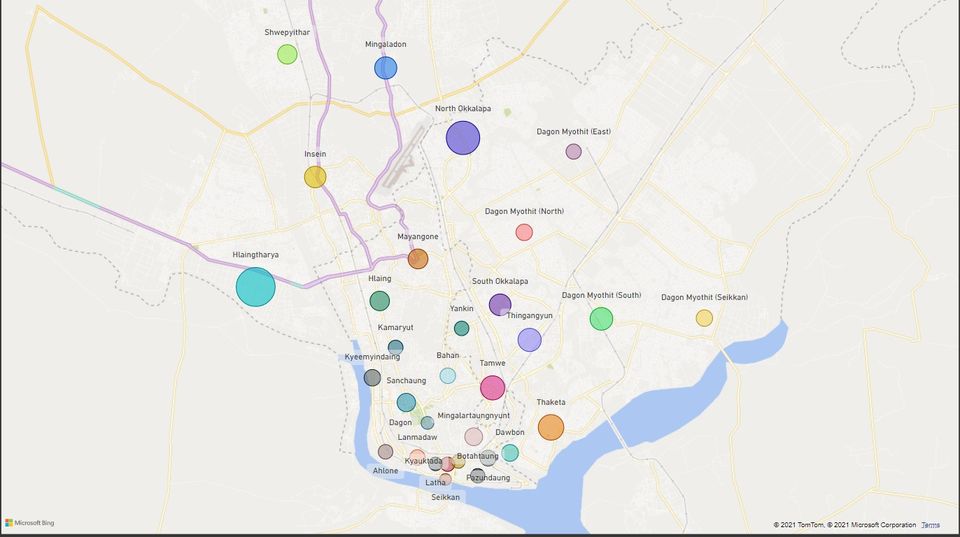
Product Distribution, Retail Market Survey စတဲ့ လုပ်ငန်းများမှာ ကိုယ့် target မြို့နယ်အလိုက် ဆိုင်တွေရဲ့ information၊ ကုန်ပစ္စည်းအမျိုးအစား availability တွေကို ကောက်ယူပြီးတဲ့ အချိန်မှာ လက်ထဲက Raw data ကို actionable information ဖြစ်အောင် ထုတ်ယူဖို့ လိုပါတယ်။ ပုံမှန် tabulation စာရင်းတွေနဲ့ ထုတ်မယ့်အစား Power BI ကို သုံးပြီး ဒီလို Interactive Visualized Presentation လေးနဲ့ ပြမယ်ဆိုရင် at a glance မှာ ကိုယ့် market situation ကို ရှင်းရှင်းလင်းလင်း မြင်နိုင်မှာပါ။ (Brand name တွေကို without permission မသုံးချင်တဲ့အတွက် Product Category level အထိပဲ ဖော်ပြထားပါတယ်။ ) ဒီပုံက မြို့နယ်တွေမှာ Outlet distribution ရှိနေပုံကို population နဲ့ ချိန်ထိုးပြီး မြေပုံပေါ်မှာ ဖော်ပြထားတာပါ။ (population နဲ့ geographic source က MIMU ပါ)။ အရင်ကတော့ ဆိုင်စာရင်းတွေကို ဒီလို မြေပုံမှာ ကြည့်လို့ ရနိုင်ဖို့ code တွေနဲ့ အသေအလဲ ရေးခဲ့ရတာပေါ့။ ခုတော့လဲ Power BI မှာ ဘာ code မှ ရေးစရာ မလိုပဲ လှလှပပ ဆွဲလို့ ရနေရော။ Trending changes.

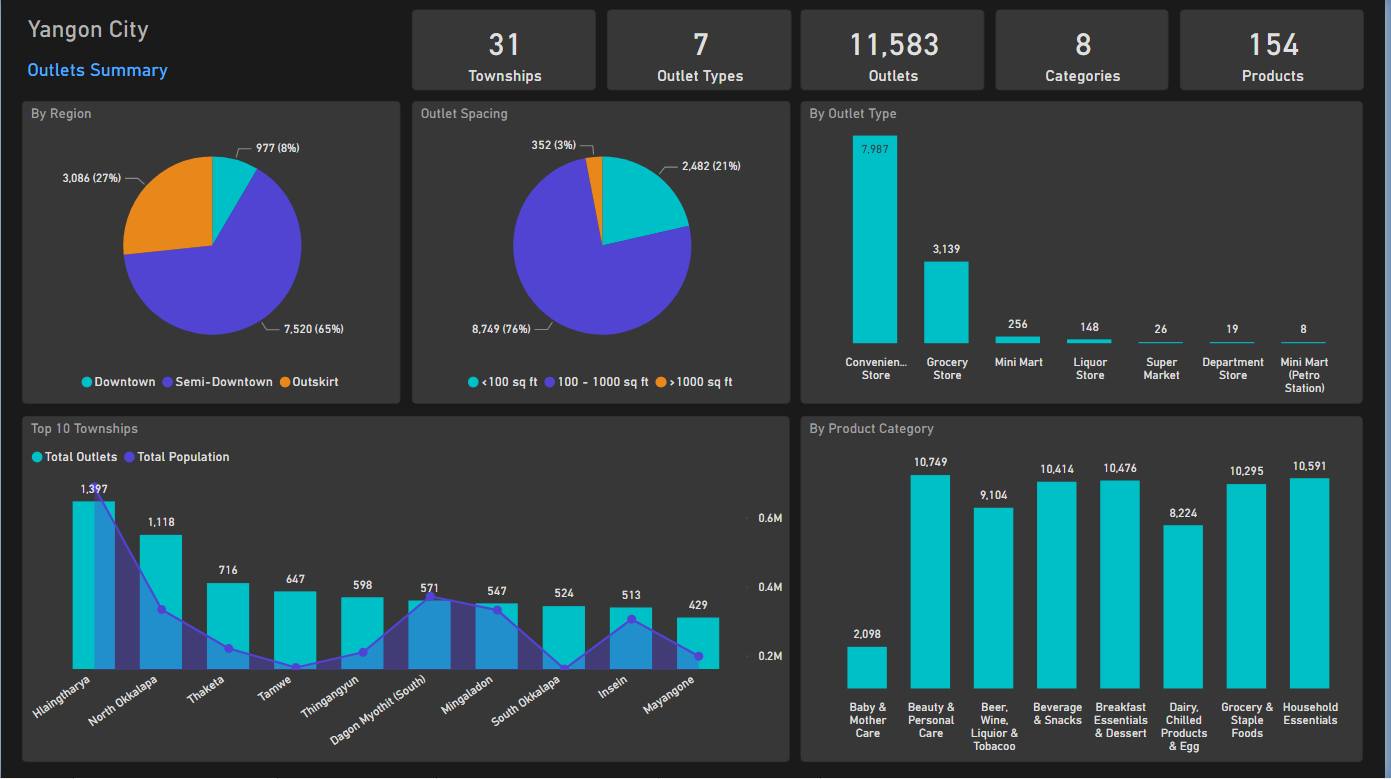
ဒီပုံကတော့ စုစုပေါင်း outlet ကို dimension မျိုးစုံနဲ့ Slice and Dice ထပ်လုပ်ပြီး ဆွဲထားတာပါ။ ရန်ကုန်မြို့ကို Downtown, Semi-Downtown, Outskirt စတဲ့ region ခွဲပြီး region တစ်ခုချင်းမှာ ရှိတဲ့ ဆိုင်စာရင်းရယ်၊ ဆိုင်ရဲ့ အကျယ်အဝန်း အလိုက် အုပ်စုဖွဲ့ပြီး ကြည့်တာရယ်၊ ဆိုင်အမျိုးအစားအလိုက် ဆိုင်အရေအတွက် နဲ့ Product Category တခုချင်းစီကို တင်တဲ့ ဆိုင်အရေအတွက် ခွဲကြည့်တာရယ်၊ ဆိုင်အရေအတွက် အများဆုံး မြို့နယ် ၁၀ မြို့နယ် ကို population နဲ့ ချိန်ကြည့်ဖို့ရယ် ပါ။ ဆိုင်အကျယ်အဝန်းကလဲ ကုန်ပစ္စည်းတင်နိုင်မှုအတွက် factor တစ်ခု ဖြစ်နေတဲ့ အတွက် ကြည့်ဖို့ လိုအပ်ပါတယ်။
