Sparkline (MS Excel 2013) ကို Excel Work Sheet ရဲ့ Cell တစ်ခုအတွင်းမှာ ရှေ့က cells တွေမှာ ရှိတဲ့ data series တစ်ခုပေါ် အခြေခံပြီး Trending chart အဖြစ် ဆွဲရပါတယ်။
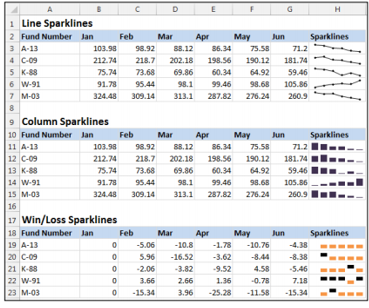
Sparkline မှာ ပုံစံသုံးမျိုး ရှိပါတယ်။
- Line Chart : ပုံမှန်ဆွဲနေကျ line chart အမျိုးအစား ဖြစ်ပါတယ်။
- Column Chart : ပုံမှန်ဆွဲနေကျ column chart အမျိုးအစား ဖြစ်ပါတယ်။
- Win/Loss Chart : Trend တစ်ခုအတွင်းမှာရှိတဲ့ အရှုံးအမြတ်ကို မြင်နိုင်အောင် high block နဲ့ low block ကို သုံးပြီး ဆွဲတဲ့ chart ဖြစ်ပါတယ်။ အလယ် Axis ရဲ့ အပေါ်နဲ့ အောက်မှာ positive နဲ့ negative data ကို ခွဲပြီး ဖော်ပြနိုင်ပါတယ်။
Sparklike တစ်ခုဆွဲမယ်ဆိုရင်
- Chart ဆွဲမဲ့ cell မှာ cursor ချပါ။
- Insert menu က Sparklines နေရာမှ Line သို့ Column သို့ Win/Loss ကို ရွေးပါ။
- cell ရဲ့ ညာဖက်အောက်ခြေမှာရှိတဲ့ + handle ကို လိုအပ်တဲ့ cell ရောက်တဲ့ အထိ ဆွဲချမယ် ဆိုရင် ရှိတဲ့ row အားလုံးအတွက် Sparkline တွေကို ရရှိမှာပါ။
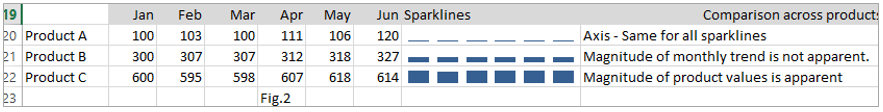
Sparkline တွေကို ရေးဆွဲတဲ့အခါ အများအားဖြင့် Figure 1 မှာပြထားတဲ့အတိုင်း trend တစ်ခုစာအတွက်ပဲ နှိုင်းယဉ်ဖို့ ဆွဲလေ့ရှိပါတယ်။ တခါတလေမှာတော့ Figure 2 မှာ ပြထားသလို row တွေမှာရှိတဲ့ category တွေကိုပါ နှိုင်းယှဉ်ကြည့်နိုင်ဖို့ ဆွဲကြပါတယ်။
A Sparkline (MS Excel 2013) is displayed inside a worksheet cell and displays only one series of data in trending chart format. 3 types of Sparkline in EXCEL as follows.
- Line : Similar to line chart
- Column : Similar to column chart
- Win/Loss : A binary-type chart that displays each data as a high block or low block.
Steps to add a sparkline
- Place the cursor where to add the sparkline
- Under Insert menu, go to Sparklines section and select Line or Column or Win/Loss as desired.
- Drag the lower right handle of the sparkline cells to required cells downward.
- The group of sparkline will be added for each category' trend.
Normally, sparkline are intended for comparing trend data as in Fig 1. But some situation it can be changed to analyze the comparison between product category as in Fig. 2. Fig.1 Comparison between Trend is just add a Sparkline in required cell or group cells without specifying any properties.
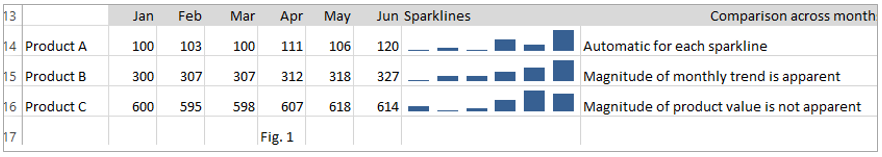
Fig.2. To add a comparison of sparkline between products.