Customer တွေကို age group လိုမျိုး master data က အချက်တွေကို အခြေခံပြီး segmentation ခွဲတာက table ထဲမှာ calculated column ထည့်တာနဲ့ ခွဲလို့ ရပေမဲ့ Customer တစ်ယောက်အနေနဲ့ တစ်ကြိမ်ထက်ပိုပြီး ပါနေနိုင်တဲ့ Sales transaction table Sales ပေါ် အခြေခံပြီး ခွဲမယ်ဆိုရင်တော့ Sales Table မှာ calculated column ထည့်တာနဲ့ ခွဲလို့မရပါဘူး။ အကြောင်းက transaction မှာက customer တစ်ယောက်ရဲ့ Sales က sales transaction များမှာ ပြန့်နေနိုင်တဲ့အတွက် လအလိုက် နှစ်အလိုက် စတဲ့ ကိုယ်လိုအပ်တဲ့ dimension ပေါ်မူတည်ပြီး Customer တစ်ယောက်ချင်းရဲ့ Sales ကို အရင် Summarize လုပ်ထားဖို့ လိုပါတယ်။
ဒီလို လုပ်ဖို့အတွက် Calculated Table ကို သုံးပြီး Summary table တစ်ခု တည်ဆောက်ထားဖို့ လိုပါတယ်။ (Power Query Editor ကနေ Group By ကို သုံးပြီး Summary လုပ်ခဲ့ရင်လည်း ရပါတယ်။ ဒီနေရာမှာ တော့ Calculated table ပုံစံကိုပဲ ပါမယ်။)။ Calculated table က သူ base လုပ်ထားတဲ့ table တွေ refresh/update လုပ်တဲ့ အချိန်တိုင်းမှာ update ဖြစ်ပါတယ်။ table ဖြစ်တဲ့အတွက် အခြား table များလိုပဲ model မှာ relationship တွေ လိုအပ်သလို ချိတ်ဆက်လို့လဲ ရပါတယ်။
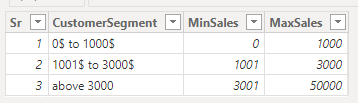
Step 1. Sales level ကို သတ်မှတ်တဲ့ table တစ်ခုကို data source ကနေ load ယူပြီး ဖြစ်ဖြစ်၊ Get Data ကနေ Power BI မှာ ရိုက်ထည့်တာပဲ ဖြစ်ဖြစ်နဲ့ တည်ဆာက်ထားပြီး “RefCustomerSegment” လို့ အမည်ပေးပါမယ်။
Step 2. Calculated Table ကို ခေါ်ပြီး formula ရေးပါမယ်။
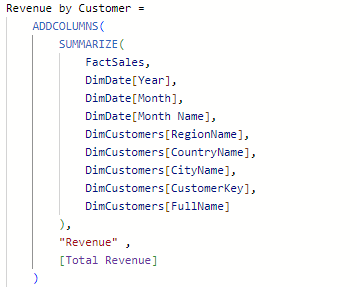
၁. SUMMARIZE function က FactSales table ကို Year, Month, Region, Country, City, Customer Key, Full Name စတဲ့ Customer တစ်ယောက်ချင်းအတွက် လိုအပ်တဲ့ လအလိုက် စုပေးပါတယ်။
၂. စုထားပြီးတဲ့ Table ပေါ်မှာ ADDCOLUMNS ကို သုံးပြီး Total Revenue measure ကို Revenue နာမည်နဲ့ ပေါင်းထည့်လိုက်ရင် Customer တစ်ယောက်ချင်းအတွက် တလချင်း စုစုပေါင်း revenue ကို ရပါမယ်။
Total Revenue = SUMX (Sales Quantity * Unit Price)
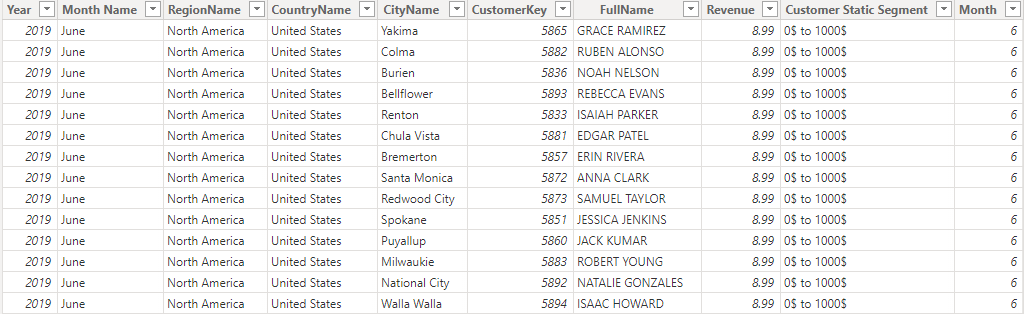
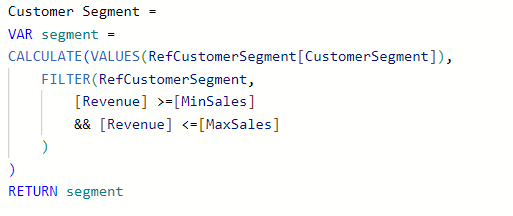 Calculate table formula နဲ့ တည်ဆောက်ထားတဲ့ Revenue by Customer ကို ရပြီး အဲဒီ table မှာ New Column နဲ့ Customer Segment ကို Min Sales နဲ့ Max Sales Range နဲ့ ချိန်ပြီး တွက်တဲ့ Formula ထည့်လိုက်မယ်ဆိုရင် Customer Segment တွက်ပြီးသား table ကို အောက်ပါ ပုံစံအတိုင်း မြင်ရပါမယ်။
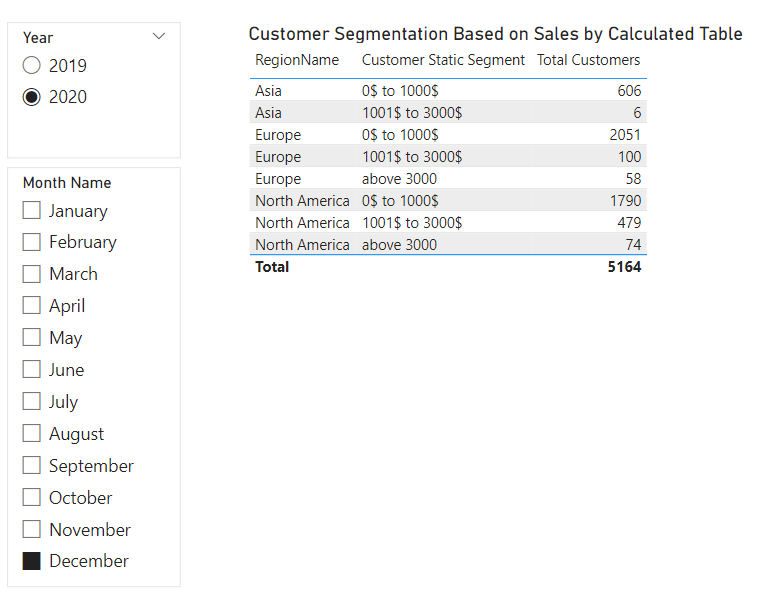
Calculate table ထဲက Year, Month တို့ကို Slicer ထားပြီး Segment နဲ့ Region ကို Table မှာ တင်ပြီး Customer Count သို့ Total Revenue တို့နဲ့ visualize လုပ်လို့ ရပါတယ်။