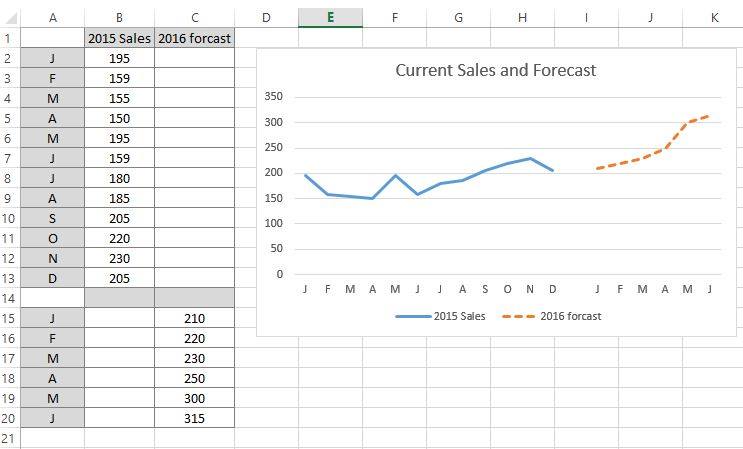
Display current and target in one line (Line Chart)
တခါတလေမှာ Chart ရဲ့ Line တစ်ခုထဲမှာ လက်ရှိ တစ်နှစ်စာ trend data ကို နောင်လာမယ့် 6လ forecast နဲ့ တွဲပြီး ပြချင်တာမျိုး ရှိပါတယ်။ ဒီပုံစံမျိုး ပြဖို့အတွက် data ပြင်တဲ့အခါမှာ လက်ရှိ 12 လ (Jan ကနေ Dec) အထိကို A2 ကနေ A13 ထိ ထည့်ပါတယ်။ B1 မှာ လက်ရှိနှစ်အရောင်းကို ဖော်ပြမယ့် 2015 Sales ခေါင်းစဉ်တပ်ပြီး B2 Read more Display current and target in one line (Line Chart)